In this article I will examine map and factions stats taken from automatch games that I retrieved from the 15th of December 2018 to the 19th March 2019. As such it is a follow up to the original articles on matchmaking and map stats, although I will look at the data from a different angle this time.
The referenced articles above also explain a little more about how I retrieved the data, and caveats involved in this. When looking at team matches, I also look at matches based on whether they are between random teams or arranged teams (RT and AT, respectively). However, this distinction is based on whether the players on one side ever appeared as team on any of the relevant ladders at any point during the period, so some of the "RT"s in this study might in fact have been arranged teams that simply did not do enough games together to get a proper ladder rank. Also, players that queued randomly but by chance got put on a team with a former or future teammate will be counted as "AT".
If two players queue together for a 3v3 match will actually have this match count for their 2v2 AT ranking. So, in theory it would be possible to reach #1 in 2v2 arranged teams without ever playing a 2v2 match. Still, for the sake of this article, ATs will only be counted as such if they play a gamemode corresponding to the AT's size. If two players play a 3v3 as AT, they will be counted as RT.
Index
- Background on rankings and matchmaking
- 1v1 statistics
- 2v2 statistics
- 3v3 statistics
- 4v4 statistics
- Conclusions
ELO, ladder, rank and win-rates
Each player or AT has a hidden ELO rating which changes after winning or losing a match, based on the ELO of both parties. The ladder then ranks every player/team according to their ELO.
Given that the different ladders have vastly different numbers of players or teams on them, ranks are tricky to compare across factions or game modes in particular beyond the top 100. Instead Relic introduced "levels" a few years ago.
If a rank is 200 or better, they directly translate to levels:
| Rank | 1-2 | 3-13 | 14-36 | 37-80 | 81-200 |
| Level | 20 | 19 | 18 | 17 | 16 |
If the rank is worse than 200 (for 1v1, for other modes the threshold can be different), levels are applied in a relative way:
| worse than | 94% | 86% | 80% | 75% | 65% | 55% | 45% | 38% | 31% | 25% | 20% | 15% | 10% | 5% | top 200 |
| Level | 1 | 2 | 3 | 4 | 5 | 6 | 7 | 8 | 9 | 10 | 11 | 12 | 13 | 14 | 15 |
So an average player in the middle of the ladder would have "level 7". At the time of writing, the OH 1v1 ladder had about 3000 players while the lowest ranked UKF 1v1 player is at about 1400. So, level 7 OH and UKF players would be found at around rank 1500 and 700, respectively.
Having two different schemes has an unfortunate side effect: Ladders having less than 4001 members will not have all levels. The reason is that rank 201 is already worse than the top 5%. For example, with 1v1-UKF ladder currently having 1400 players, levels 14 and 15 are missing.
So, instead of levels, I will be using percentages of the ladder ranks in the plots shown in this articles. This will directly relate to ranks above 200 according to the table above. Data for players at rank 200 or better will show up in the data points for 5% and better.
This article also contains a lot of winrates. I would be careful to draw premature conclusions about the state of balance based on these numbers, for a couple of reasons:
- Technically, the matchmaking is supposed to balance factions to some extent. Basically, if a faction is weaker, a player should be matched with a less skillful player playing a stronger faction (some examples on these concepts and the issues involved are found here). Obviously this scheme will fail at both ends of the skill range, but for the players in the middle of the ladder you could expect a 50%ish win-rate. Note, though, that there are a couple of things that the matchmaker probably does not take into account, e.g. faction performance on a certain map. And when match random teams vs. arranged team everything goes, I guess.
- Now, matchmaking should work reasonably well when there are tons of players queuing for matches. That, unfortunately, is not the case. The result is that win rates are not very reliable. Consider an example where the only players queuing are
- Faction A: Has a pro and three newbs queuing.
- Faction B: Has four mediocre players queuing.
Now, the pro is likely to win while the new players likely will lose. The result is that faction A has a winrate of 25% and faction B sits at 75%, regardless of the actual faction balance. And then there is the chance of 80% what one of the three less skilled players create a thread about how OP faction B is and he even can back this up with numbers!
- Faction A: Has a pro and three newbs queuing.
So, why list the win percentages at all? At the end of the day, these rates reflect the actual player experience. And I will try to flood this article with LOTS of graphs splitting up win rates in various ways with the main message of "It's complicated!"...
Back to Index
1v1
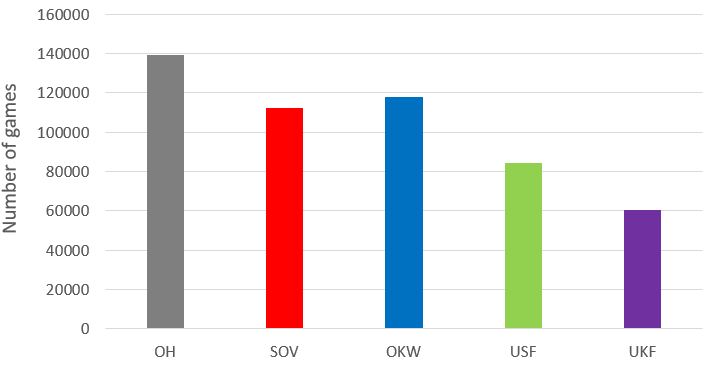
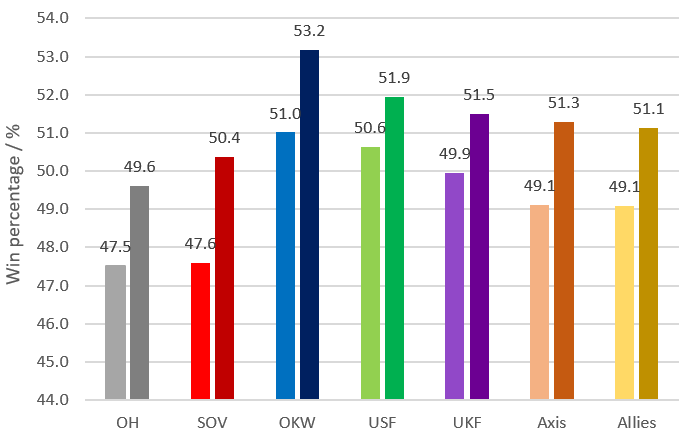
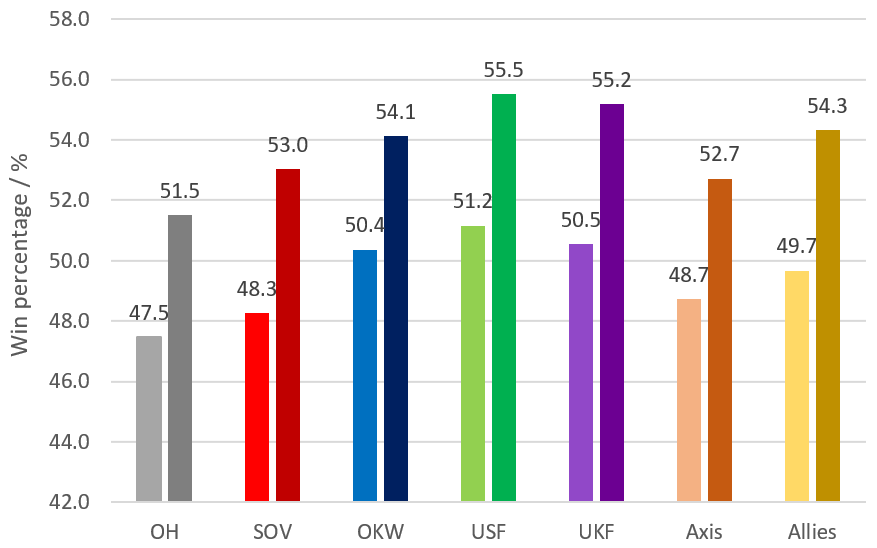
Starting with 1v1, the diagram above shows the number of games played per faction. OH is more played than OKW, while SOV is still the most played allied faction, followed by USF and UKF.
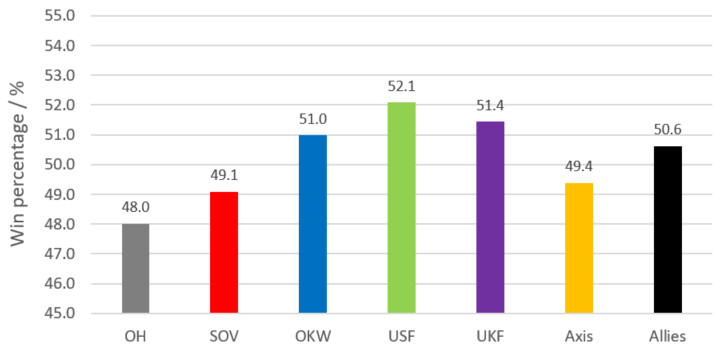
Overall, win percentages for all factions (see above) are pretty close to 50%. USF is most successful with an overall win percentage of about 52%, whereas OH seems to get the short end of the stick. On the allied side, the Soviets wins least. But let us look into this in more detail.
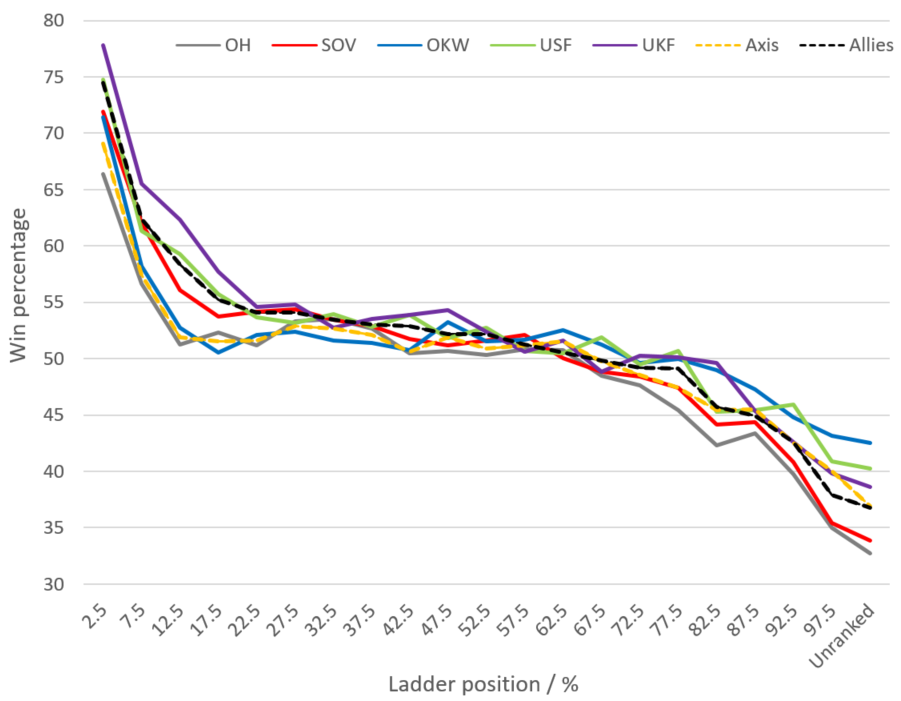
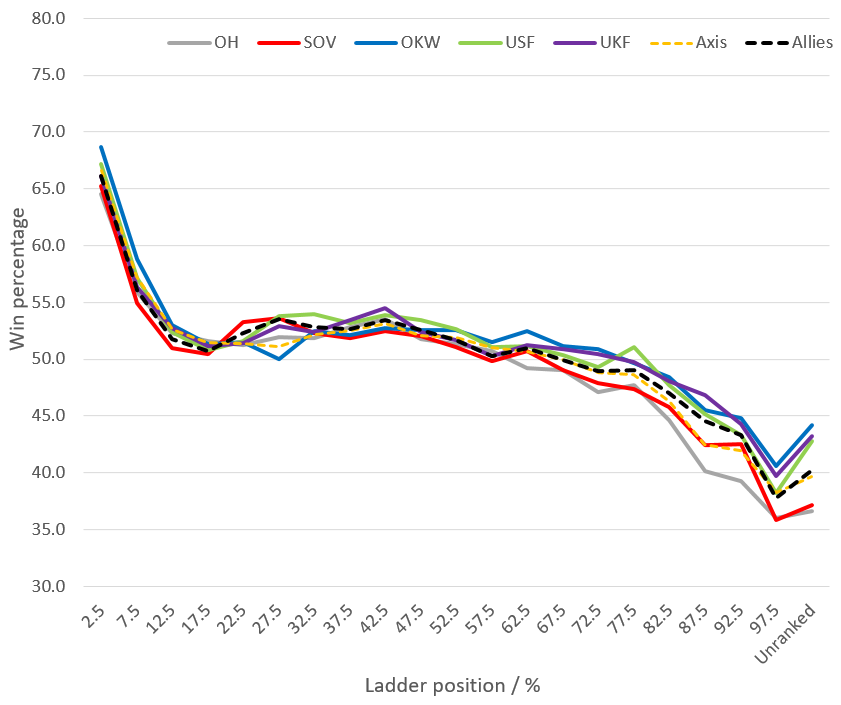
Win percentages do depend on the player rank. The general shape of the curves above are very similar: The top percent of players have win percentages of around 70%. For most players win percentages hover just above 50% before dropping off for the highest ranks. Unranked players on average fare even worse than then the weakest ranked players.
Up to the 22.5% bin, allied players feature the highest win rates with UKF topping the charts. In the mid-ranges factions are quite even. Beyond 67.5%, OH and SOV exhibit the lowest win rates, while OKW is on top.
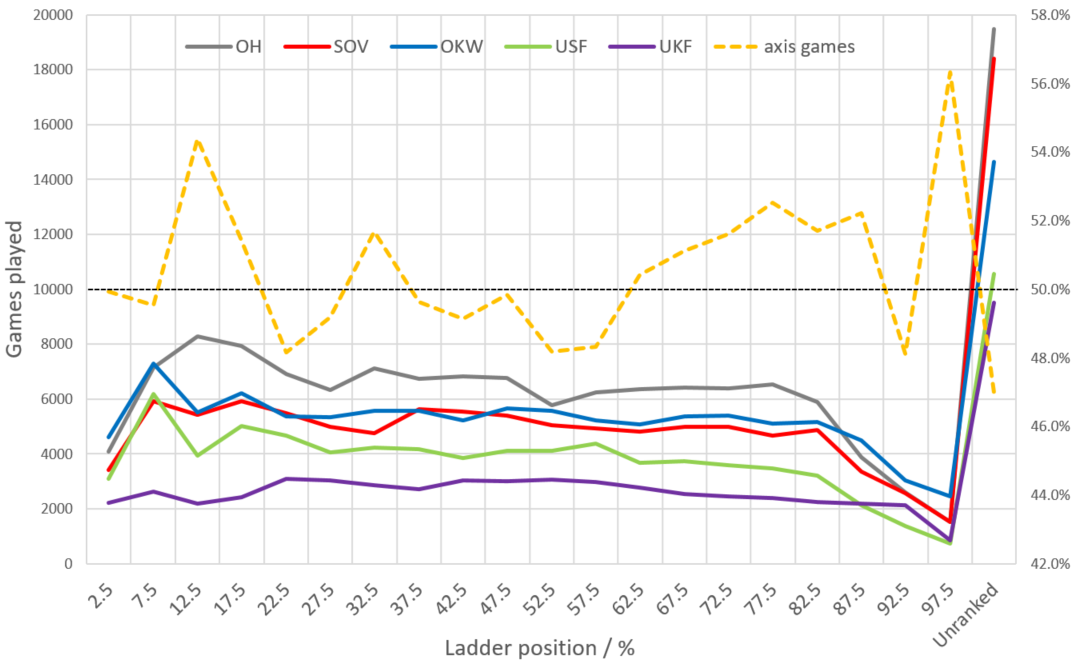
The diagram above shows the number of games per faction for each percentage bin. In addition, the dashed orange line shows percentage of axis games in each bin (e.g. 54% means that 54% of games played in this specific bin are played with axis faction, that is, more players in this ladder bin queued with an axis faction).
There are a couple of noteworthy trends: The most games are played around the the top 12.5% bin of the ladders (although there are far more games yet played by unranked players). The number of games are relatively even across most parts of the ladder, but seems to taper off beyond 80% ladder rank.
Across most ladder ranges, more axis players play as OH, with the exception of the top 10% and bottom 10%, where OKW is more commonly played. For allies, SOV are generally most commonly played, with the exception of the top 10%, where USF is about as popular.
Checking out the relative distribution of games played as allies or axis, that the top players up to 10% ladder ranks play more games as allies, followed by a significant maximum at 12.5% for axis games. Beyond that, again more players queue with allied factions until at around 60% of the ladders where axis is more played most commonly.
Finally, there are more allied games played by unranked players. This might be expected due to the fact that there are three allied factions so in order to get a rank in either of those a player would need to play 30 unranked matches as opposed 20 matches to get a rank for each of the two axis factions.
Now, the somewhat uneven distribution of games over ladder rankings is likely to have some effect on the overall win percentage of a faction and win percentage per ladder bin. However, I'd have to speculate on how this distribution manifests itself in detail. It seems save to assume that the fact that the allied factions are played more often by the top players and that there are more players at the bottom of the ladder playing axis will not help the win percentage of the axis factions. It is tricky to say what the effect of the axis games bump at around 12% is.
Note, that the unranked players typically are not matched with the players at the bottom of the ladders. The low win percentage for those unranked, predominantly allied players will certainly bolster the win percentage of the axis players in whatever bin they happen to be matched against.
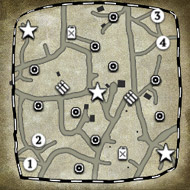
1v1 - maps
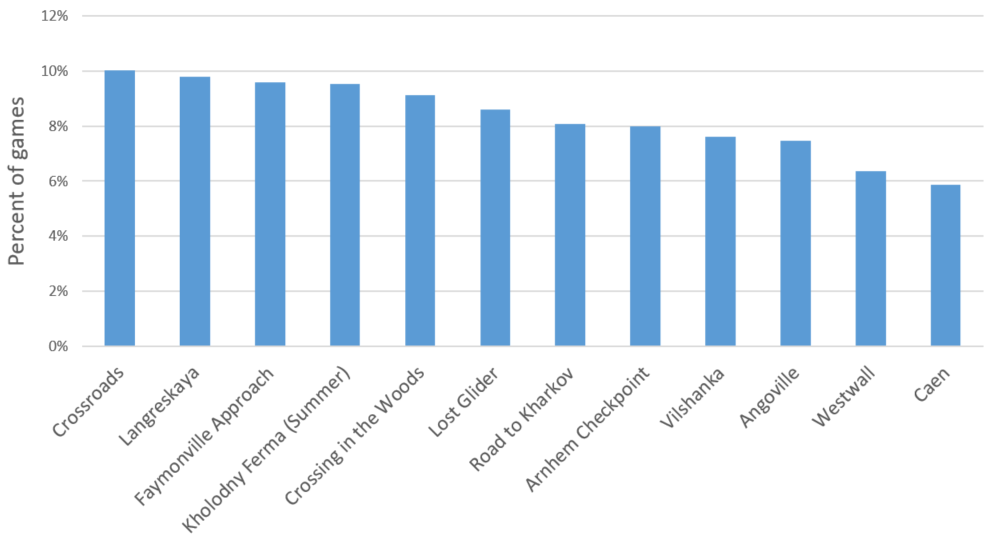
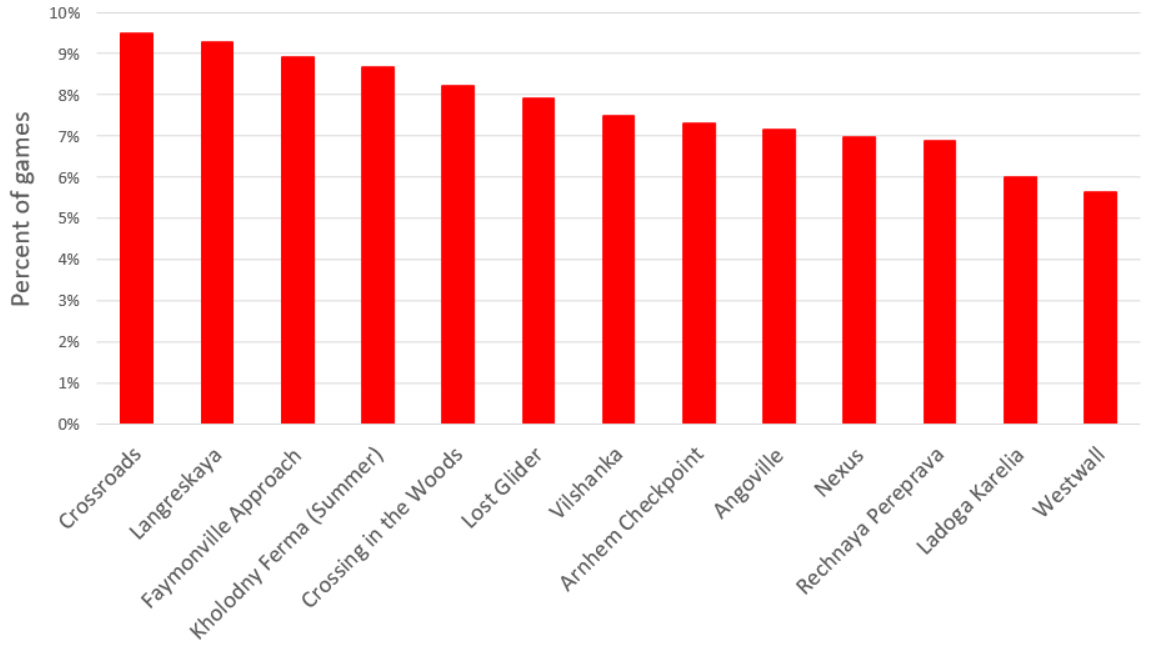
Here are the numbers of games played on each of the maps there were available in automatch in the first quarter of the year. Crossroads is the most popular (least vetoed) map. The least favorite map was Caen, which subsequently got removed in the recent patch. The other map that was removed, Road to Kharkov was actually about in the middle of the pack.
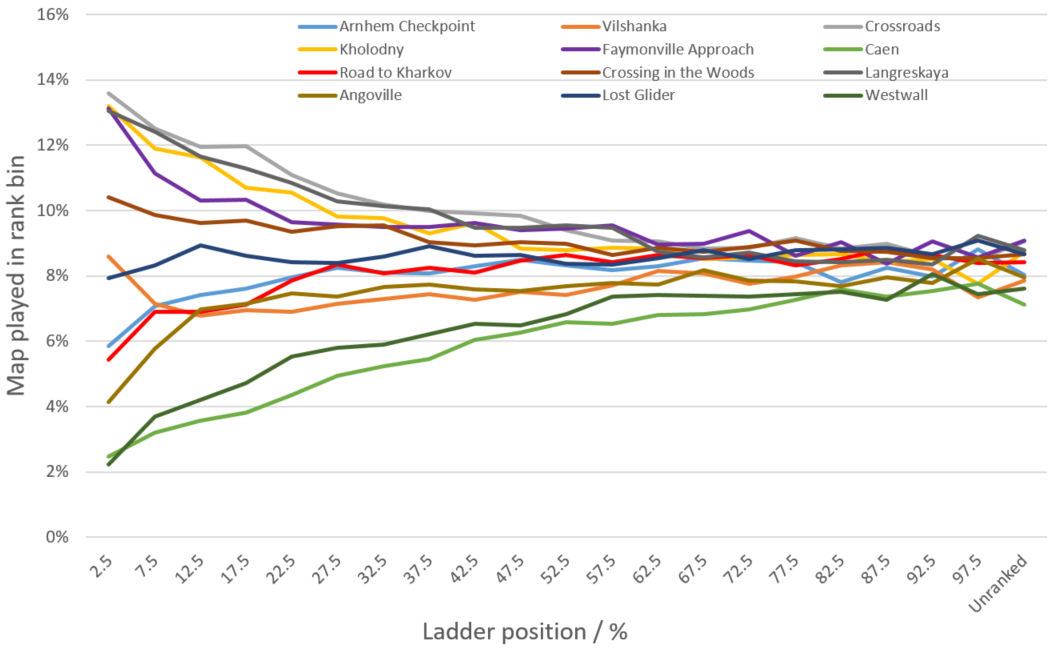
Map vetoes might different depending on the player rank. What is displayed above is the relative number of picks in games played in a given bin. For example, top players play almost 14% of their matches on Crossroads while they play on Westwall in just above 2% of games.
Overall, the ranking of maps is reasonably similar across the ladder. However, the higher the players rank, the less vetoes apparently get used as for higher ladder ranks, the pick rates get closer and closer to the 8.3% that we would have if no vetoes are not used whatsoever.
The most discrepancies in pick rates appear for the top players. Here, Crossroads, Kholodny Ferma, Langreskaya and Faymonville approach are by for the most played maps. Next is Crossing in the Woods, which is just above average. Vilshanka fares reasonably well with top players, while it overall is not very popular with the rest of the players.
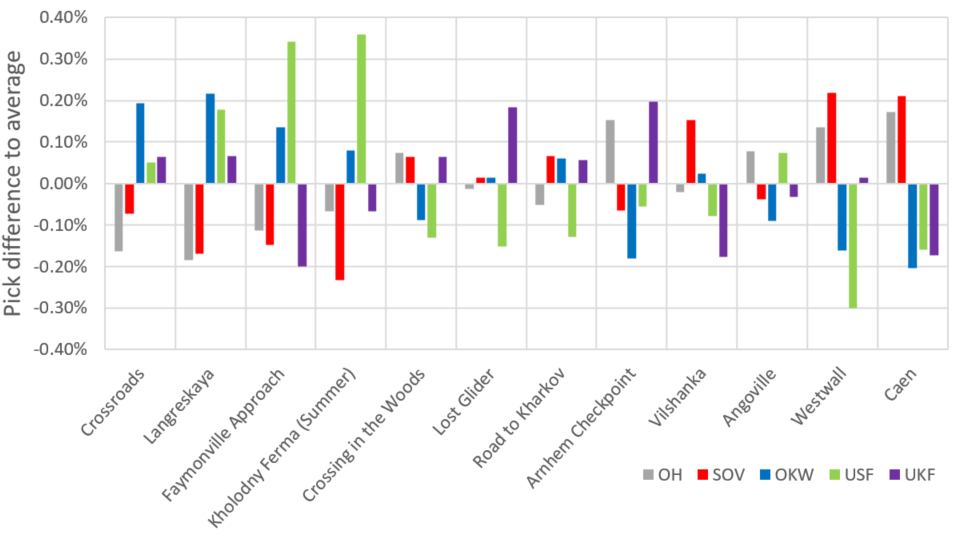
The differences in map picks based on faction are not that big, but one observable pattern is that maps that are popular with OKW are also popular for USF. Similarly, there is a correlation between map picks for OH and SOV.
What seems interesting is that the more popular maps are even more popular for USF and OKW and less popular for OH and SOV, while on the other hand for the least popular maps the trend is the other way around. The connections are complex, though. As seen earlier, faction preference as well as prevalence to use map vetos seem to depend on the ladder position.
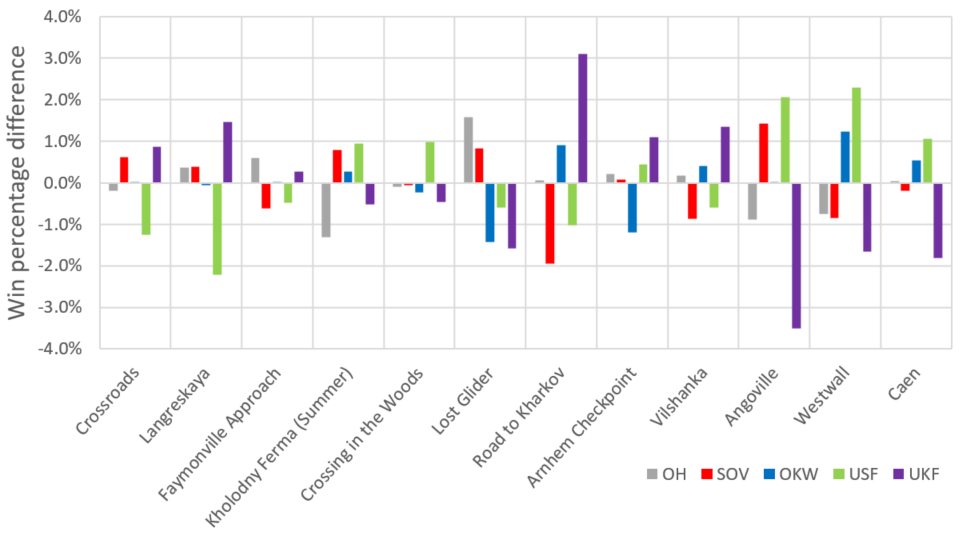
The diagram above shows win percentages per faction and map. It should be noted that the differences are not huge and the data easily has an uncertainty of some 0.2%; the uncertainty will be higher the less a specific map or a specific faction is played. Also, I have no way to determine the starting positions for a given game from the data I get. Maps that have very imbalanced starting positions will appear as being very balanced faction wise.
Update:
In April the Spring Map Update brought three new maps into the 1v1 automatch pool, Nexus, Ladoga Karelia and Rechnaya Pereprava while Cean and Road to Kharkov were removed. The diagram below shows the map picks for about 120k 1v1 automatches from the 17th of May to the 8th of July:
So far the new maps are not overly popular with only Westwall being played less often.
Back to Index
2v2
Now we move on to team games. This and the following sections show different data for arranged and random teams (AT and RT, respectively). As mentioned in the introduction, there are some problems in making that distinction in that the match data itself does not indicate if one of the parties queued as team. Furthermore, I do not download the team information from the player's cards. Instead, a team is recognized solely by reading the team ladders for the whole time period. If all players on one side at any point appeared as a team on the relevant ladder, the team is marked as AT, otherwise it will be considered RT. As a result, I expect that there are several matches where a AT was not recognized as such because the player did not do enough matches together to get a proper rank on e.g. the 2v2 ladder.
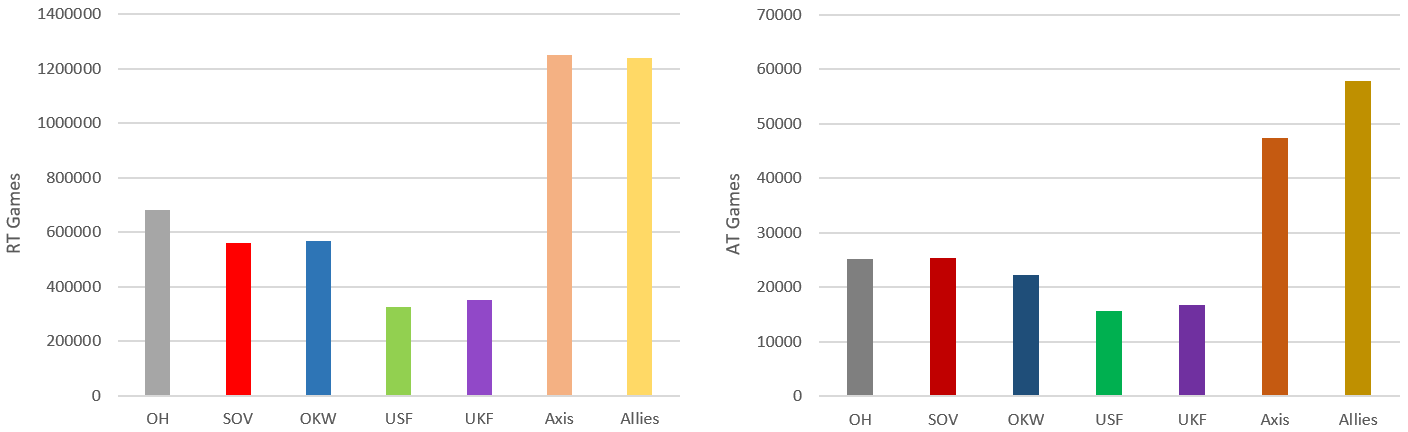
Above, win percentages for the factions are shown for RTs and ATs. Arranged teams seem to have roughly a 2.5% point higher win rate than random teams. The discrepancy is smallest for USF (1.3%), and largest for SOV (2.8%). Overall, again the Eastern front factions exhibit the lowest win rates, the highest win rates are achieved by OKW and USF. Overall, axis and allies win rates are almost identical.
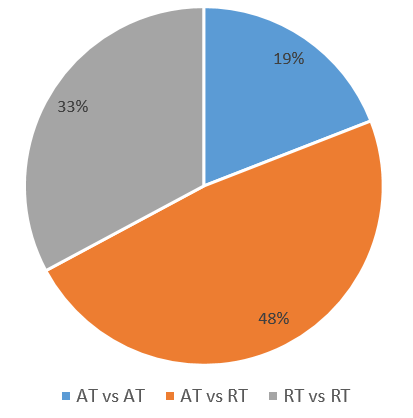
The pie chart above shows how often ATs and RTs are matched with each other. It turns out that AT vs. AT happens in a respectable 19% of games. Keep in mind that there are probably a lot of ATs that are misidentified as RTs, so in reality this number likely is higher.
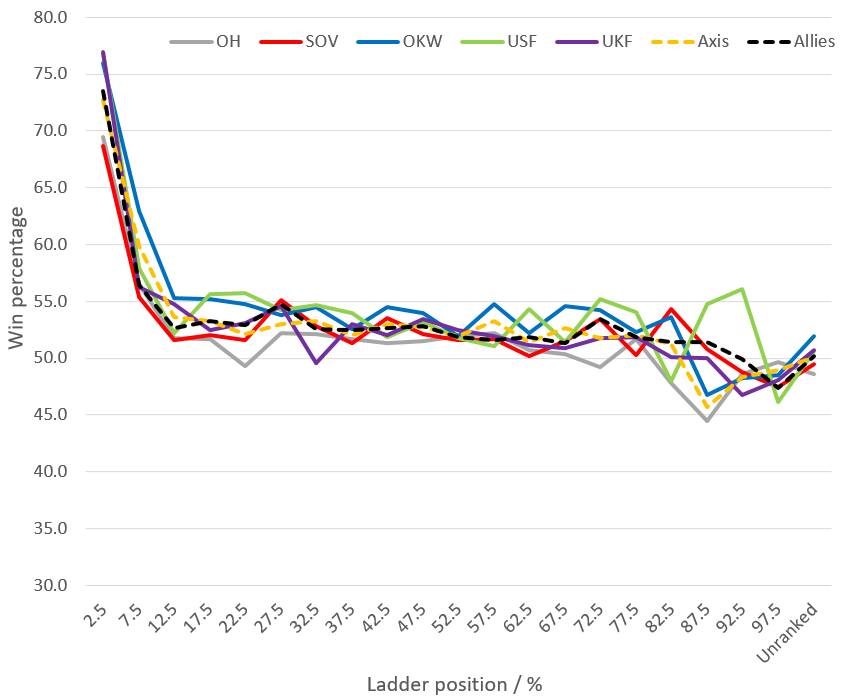
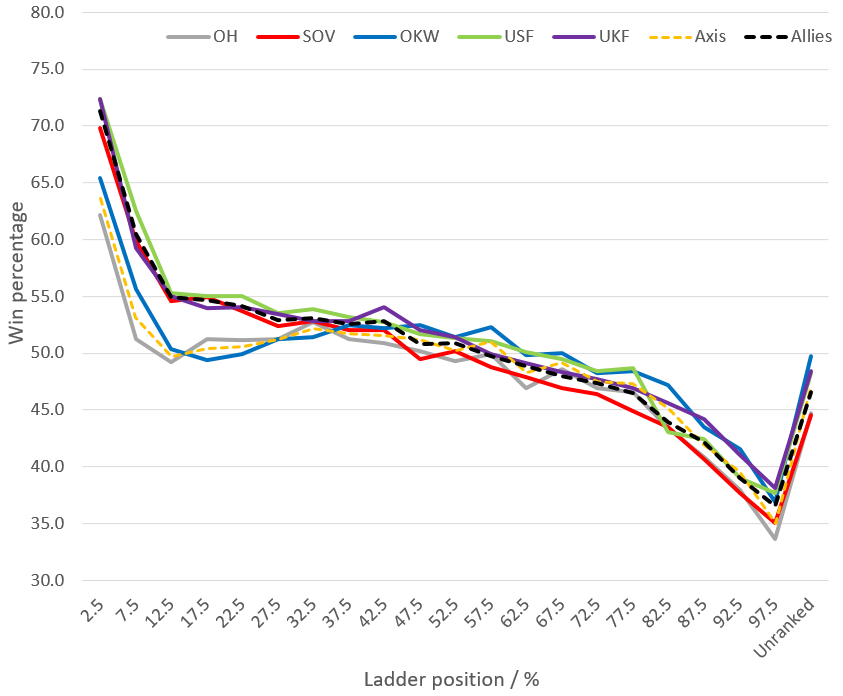
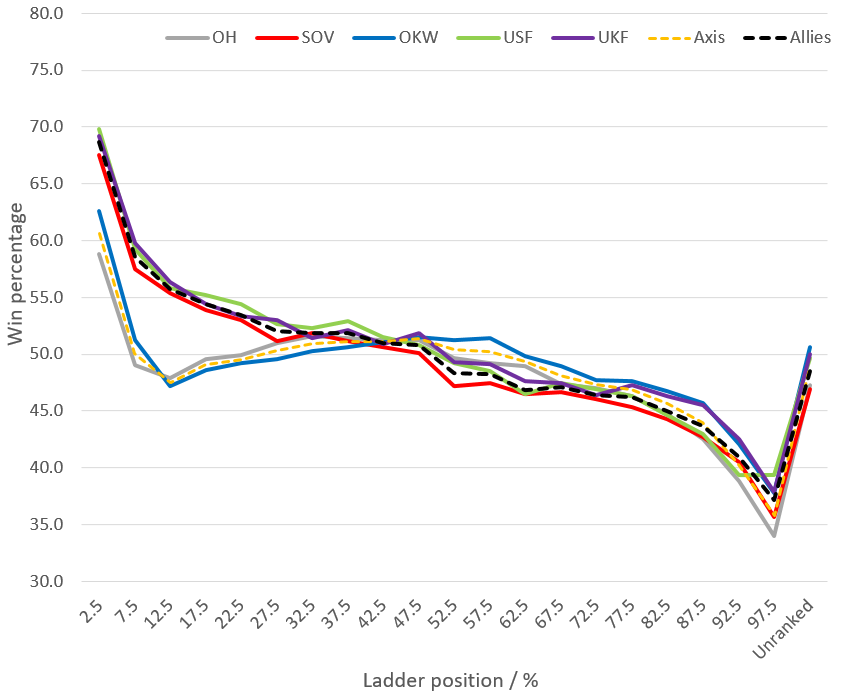
The general pattern for the win-rate per ladder position for random games is very similar to what we found for 1v1 in that the top players of course achieve very high win rates while lower ranked and unranked players do not fare as well. The discrepancies between factions, however, is not as pronounced as in 1v1. Over most ladder ranges OKW and USF are performing best.
If we look at the details, we see that at around 12-20% ladder rank, the win percentages seem to exhibit a minimum with win rates being higher at around 40%.
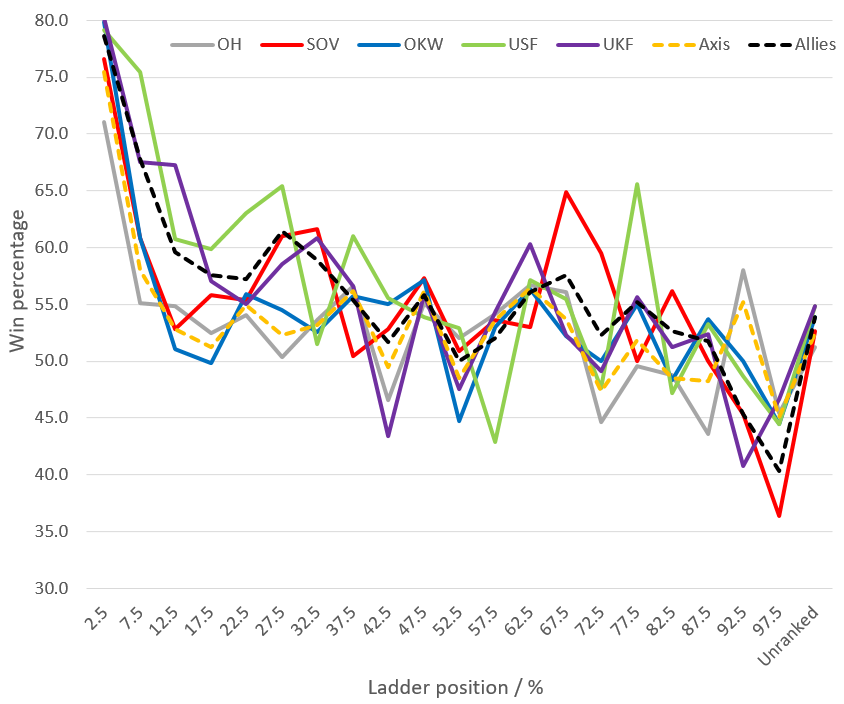
The lines above again show the win-rate per ladder position for arranged teams. The curves are way more noisy, mostly because there are way less games contributing to the statistics. Again, the highest ranking teams have the best win percentages. However, for the rest of the ladder, the win percentages are almost constant, barely dipping at the end of the ladder. Also, the unranked teams achieve reasonably high win percentages.
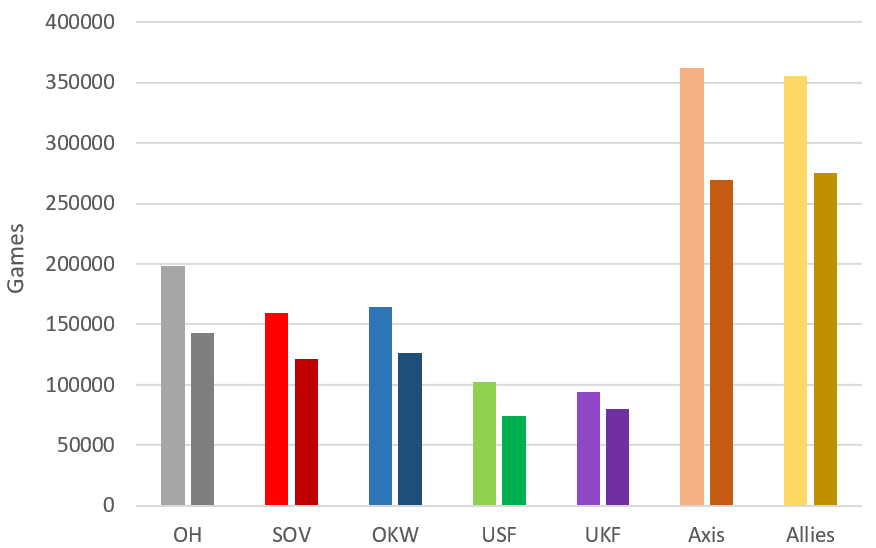
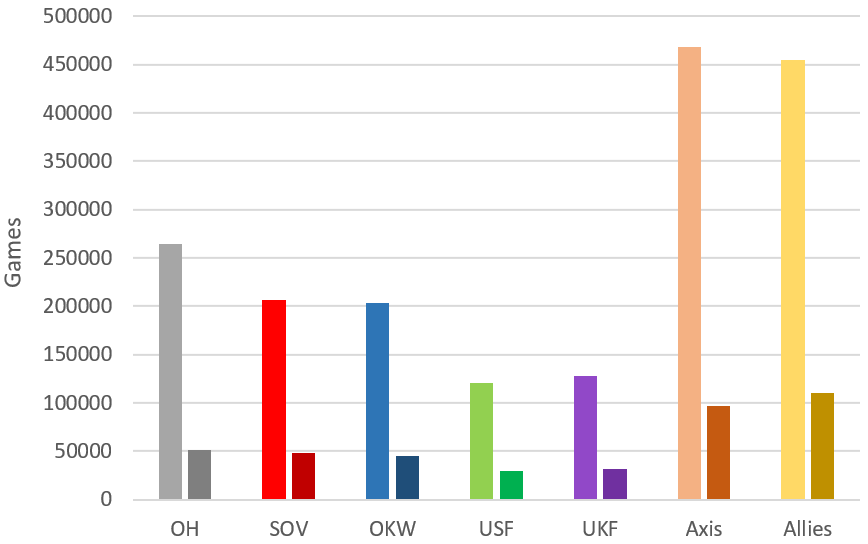
In the number of games played per factions, columns with darker colors show the numbers for AT, lighter columns are for RT. Overall, eastern front factions are played most. Note, that this is actually counting games per faction and player, so e.g. a game of double OH vs. a USF/UKF team will appear as 2 OH games in this and all similar diagrams in this article.
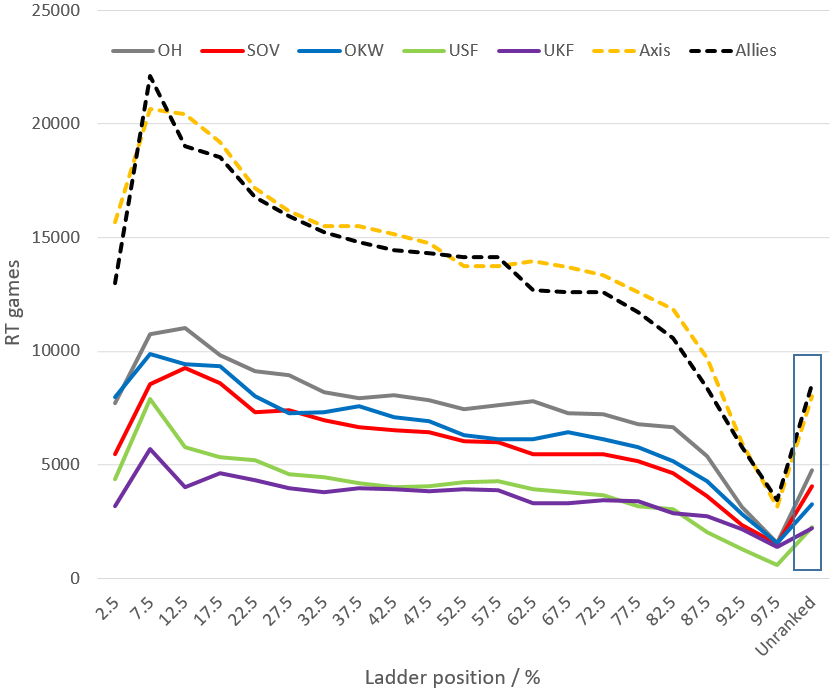
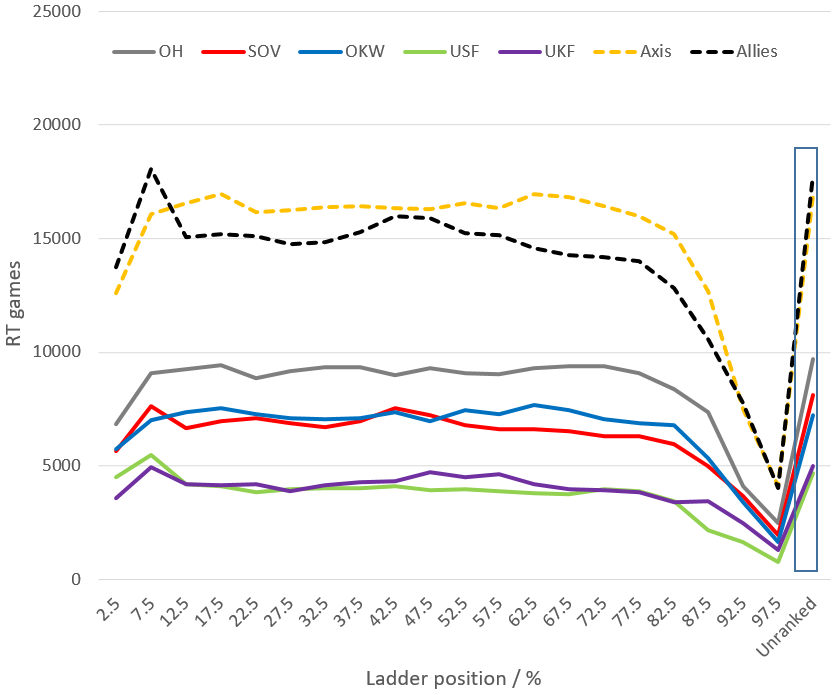
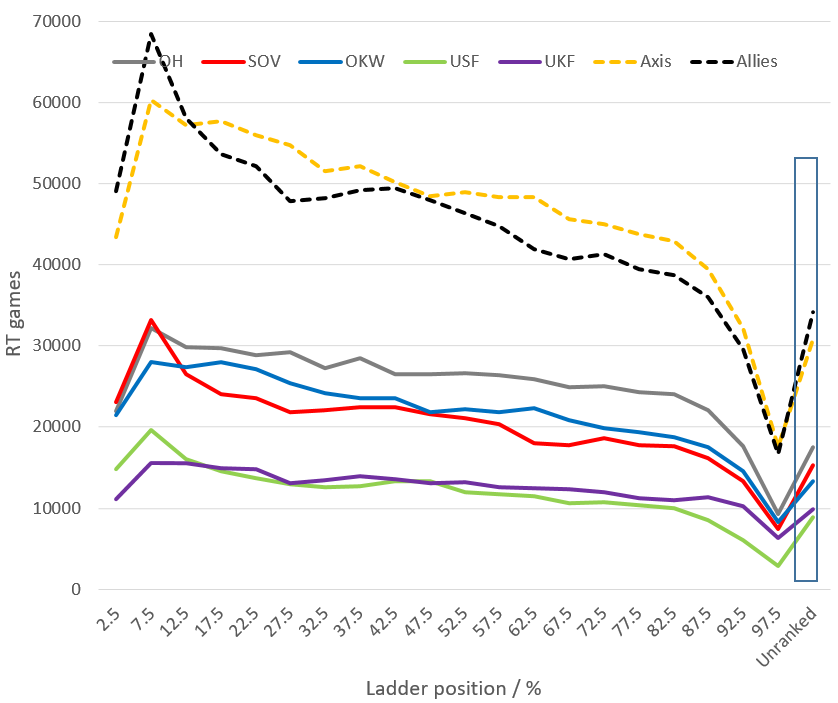
The number of games played as RT per faction and ladder rank is shown in the diagram above. There are so many games played unranked, that the numbers there are divided by 10 for clarity. Here, there are more games played as SOV than as OKW, whereas for most other places on the ladder the opposite is the case. USF are more commonly played by players ranked in the top 35%, whereas beyond 80% UKF is more commonly played.
We further notice that a maximum of games played is at around 10% and that there are less games played by higher ranking players than those played at around 20%. This means that players at around 10% are more likely to be matched with players at around 20%, which might be reason for the dip in win percentage observed in the latter ladder range.
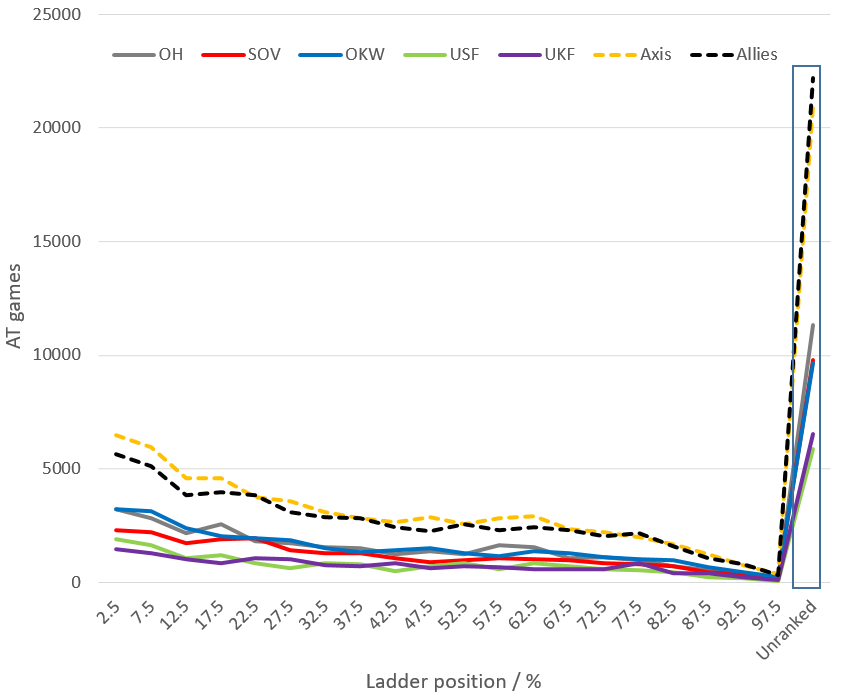
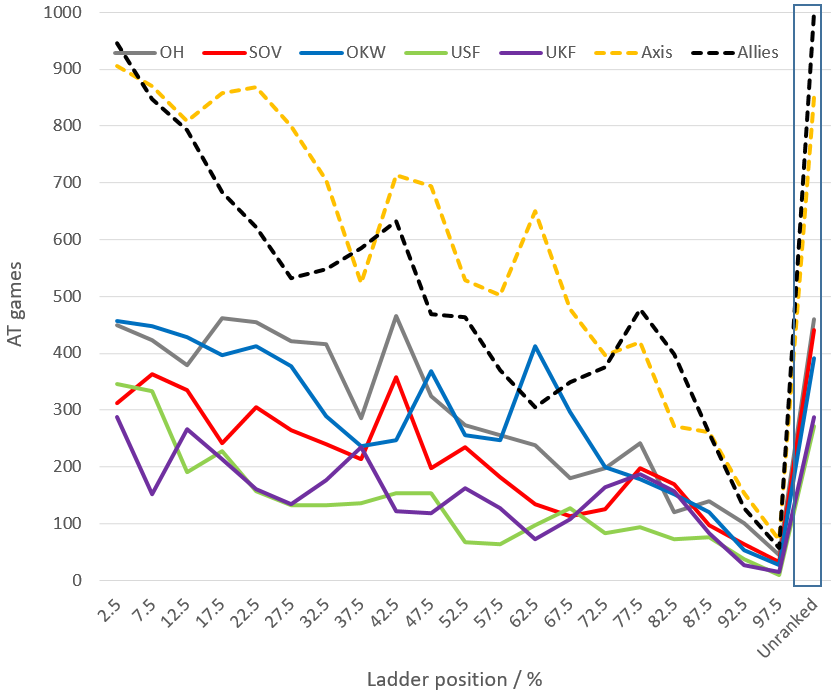
Curves above shows the same breakdown for ATs. Even when dividing the number of unranked games by 10, the games played there is compared with the other games. This might reflect the fact that you have to go through the 10 ranking games every time you pair up with another partner, which is likely to result in more games played without a proper rank.
Across the ladder, OKW is played about as often as OH (however, OH is more played for unranked games). Similarly, USF is played about as often as UKF, while SOV is the most commonly played allied faction.
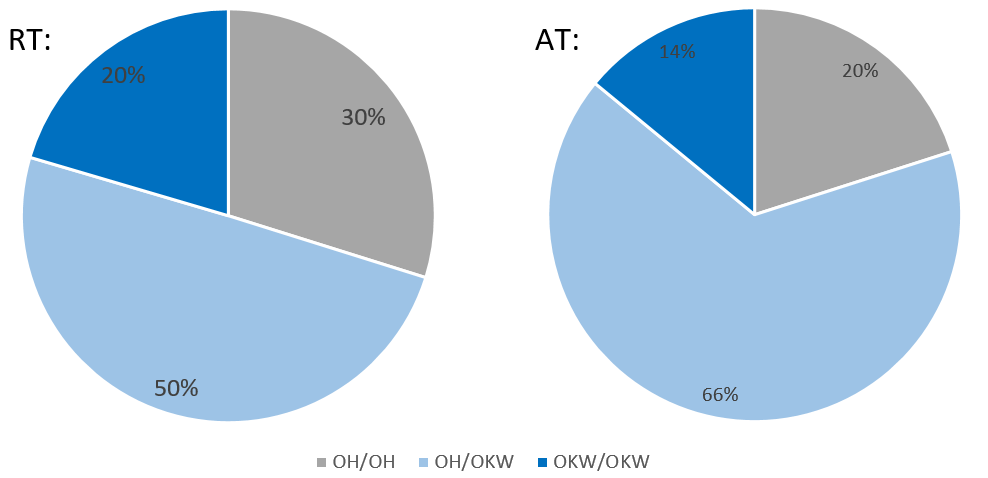
Team compositions for RT (left) and the AT (right) are broken down in the pie chart above. Mixed teams seem to happen more often in AT. Matchmaking is probably not taking team composition into account while ATs actually do have a choice there. Thus, it might be even more notable that there are a considerable amount of games played by single faction ATs. In both cases OH/OH is more common than OKW/OKW.
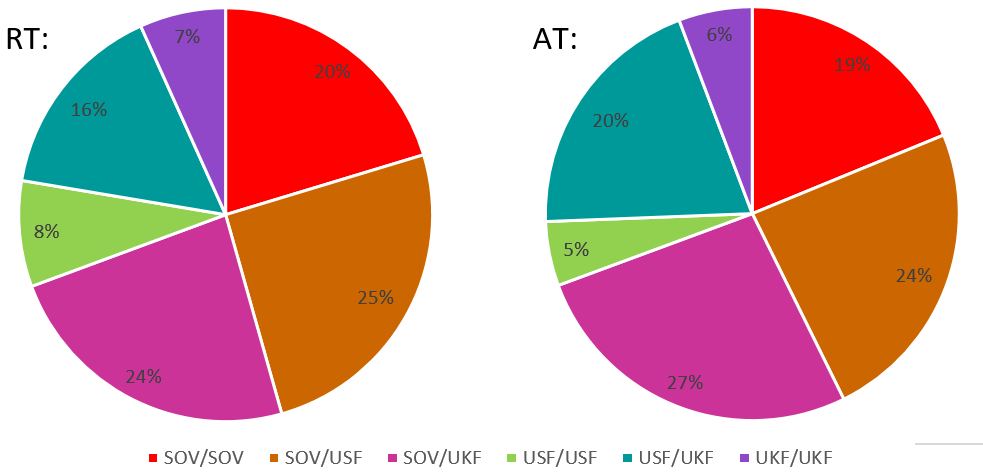
The pie charts above shows the allied team composition. There are only minor differences between RTs (left) and ATs (right), although the latter feature slightly more USF/UKF teams.
Almost 75% of games are played with at least one SOV on the team. Double UKF or double USF are played in only a minority of game, while double SOV is played in about 20% for RT and AT.
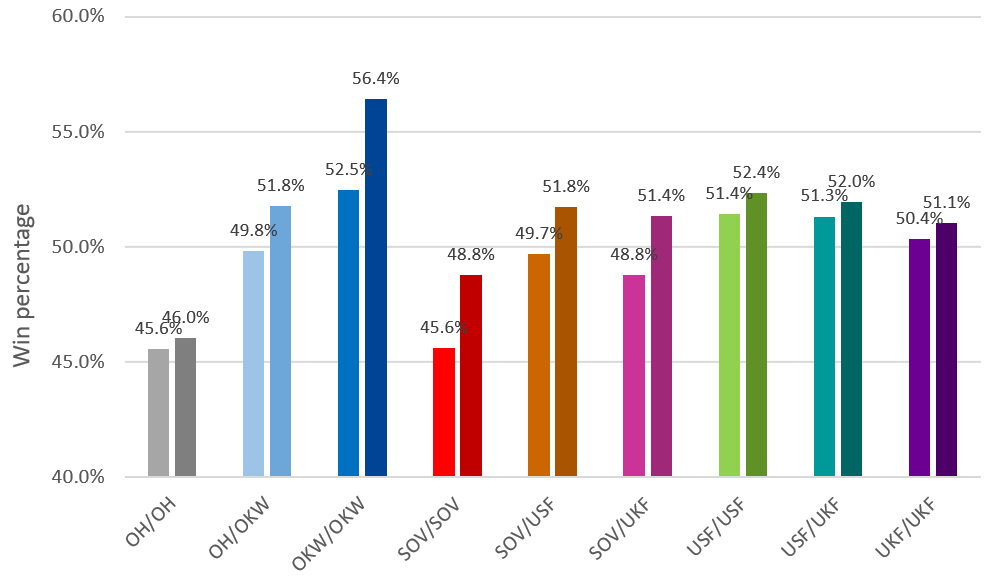
The diagram above gives the win percentage based on team makeup. The darker columns indicate the numbers for ATs. On average numbers for arranged teams are about 2% higher. However, the difference depends much on the specific team comp. There are only minor differences for OH/OH, while OKW/OKW has about a 4% higher win percentage when played by an AT compared with an RT. Still, the OKW/OKW win percentages are higher than those for OH/OKW, which in turn are higher than for OH/OH.
OH/OH achieves the lowest win percentage, only matched by the RT SOV/SOV win rate. However, the latter team exhibits far higher win percentages for ATs. The most successful teams on the allied side are USF/USF or USF/UKF.
2v2 - maps
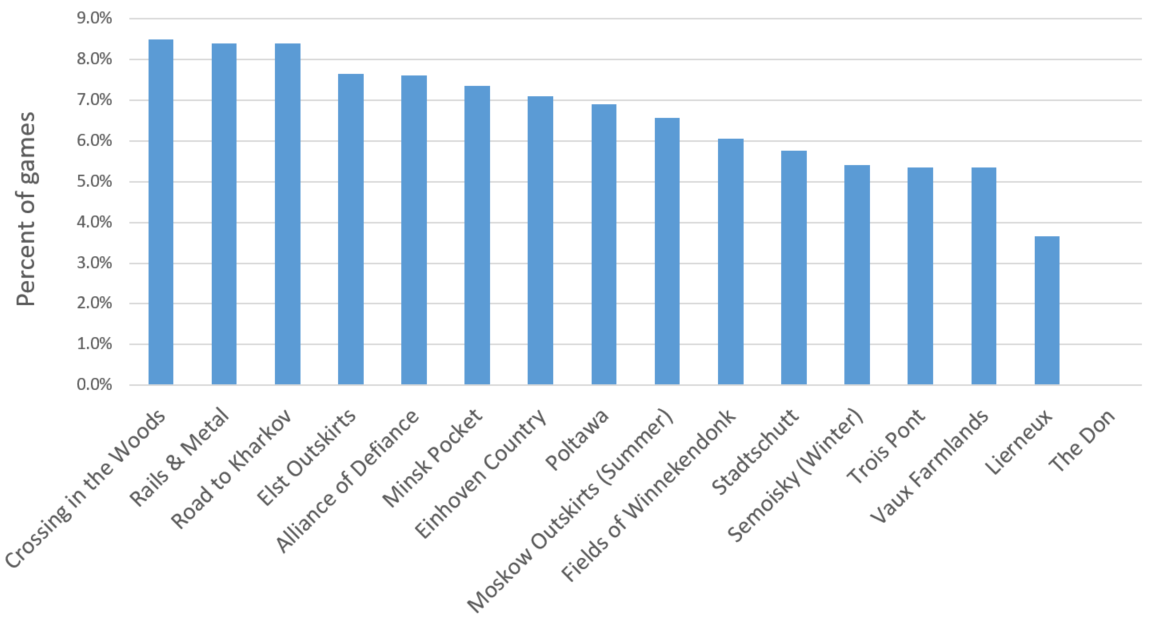
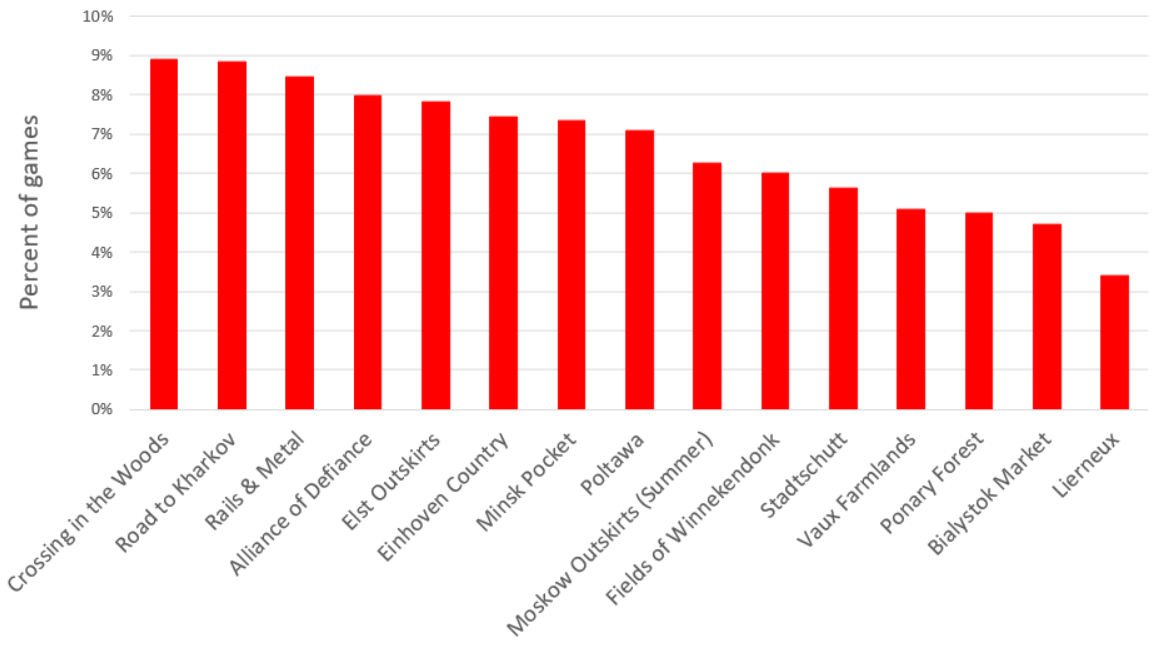
The number of automatch games played on the different maps is indicated by the bar diagram above. "Crossing in the Woods", "Rails & Metal" and "Road to Kharkov" again are the most popular maps, while "Semoisky (Winter)", "Trois Pont", "Vaux Farmland" and "Lierneux" are the least popular ones. And then there was a freak game on "The Don".
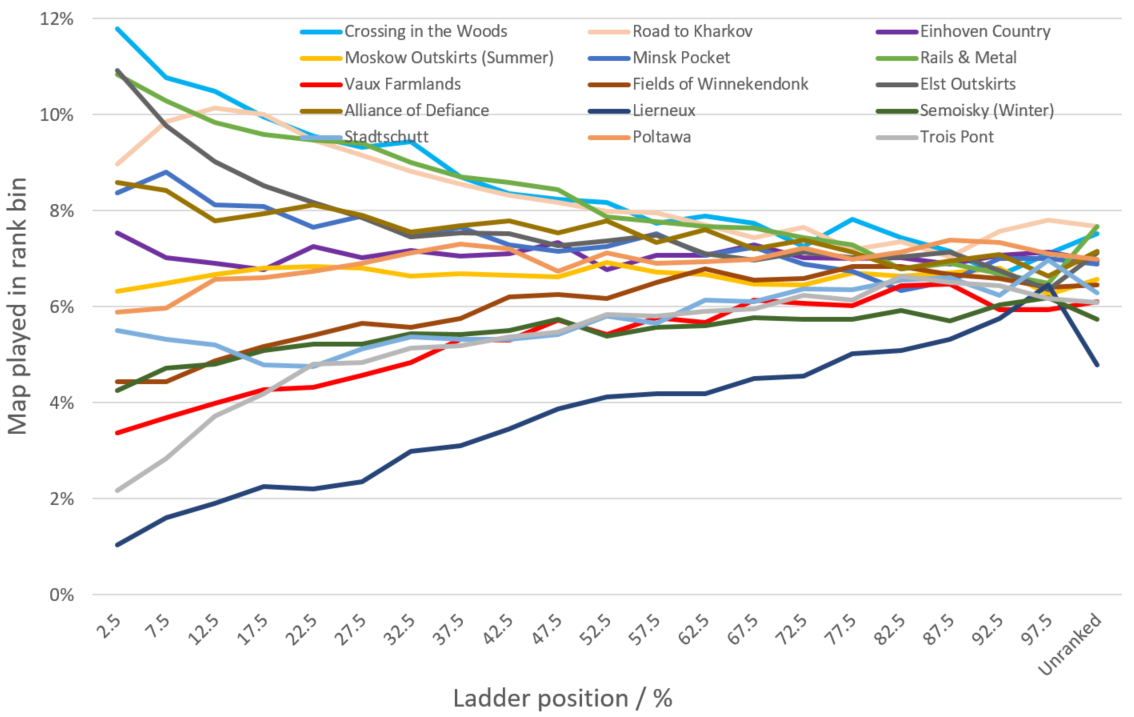
These are the lines for maps vs. ladder rank. Again, the higher the rank, the less consistent the vetoes, as found already for 1v1s. Overall, the maps ranking is fairly similar across ladder positions. However, there are a few notable differences in the map choices of the top players:
- "Road to Kharkov" and "Trois Ponts" are significantly less popular there.
- "Eindhoven Country" and "Stadtschutt" are more popular.
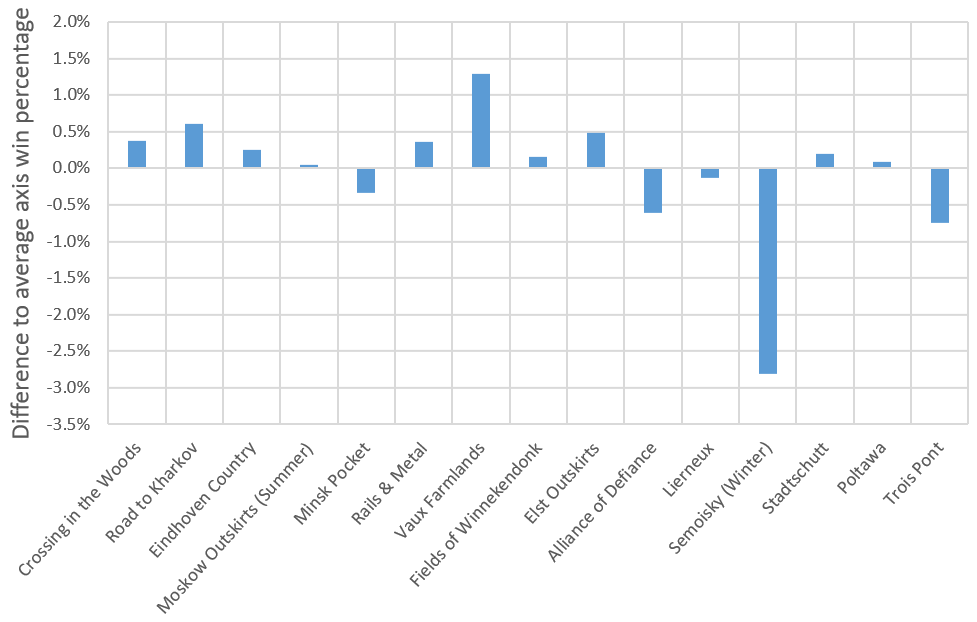
The diagram above shows the difference between the average axis win percentage and that win percentage for a certain map. The biggest outlier is "Semoisky (Winter)" where apparently the axis side on average looses more often. "Vaux Farmland", on the other hand, seems to favor axis most.
The next best maps for axis appear to be "Road to Kharkov" and "Elst Outskirts", while allies on average might be doing slightly better on "Trois Points" and "Alliance of Defiance". That said, the uncertainty of the data is certainly higher than 0.2%, so these differences might not be overly significant.
In the most recent patch "Semoisky (Winter)" and "Trois Ponts" have been removed from automatch, which appear to be some of the lesser balanced and likewise least played maps.
Update:
The Spring Map Update also brought two new maps to the 2v2 automatch map pool, namely Ponary Forest and Bialystok Market while Trois Ponts and Semiosky Winter are removed. Map picks after about 148k games played between the 17th of May to the 8th of July are:
Similar to the new additions in the 1v1 map pool, the new 2v2 maps are not very popular but beat out Lierneux.
Back to Index
3v3
With, another issue arises when discriminating ATs from RTs. First up, players might queue with a team that has less members than the team mode requires. E.g. two player might queue for a 3v3 game and subsequently will get an additional random player for the game. Yet, for the team of two, the game actually counts towards their 2v2 AT ranking. For this statistic, the team of two players that queued together and one random player will be counted as RT.
Furthermore, I would expect way more fluctuation of players the larger the number of players grows, so it seems less likely that the larger teams manage to do all required ranking matches and thus for that reason will not be recognized as AT in this statistic.
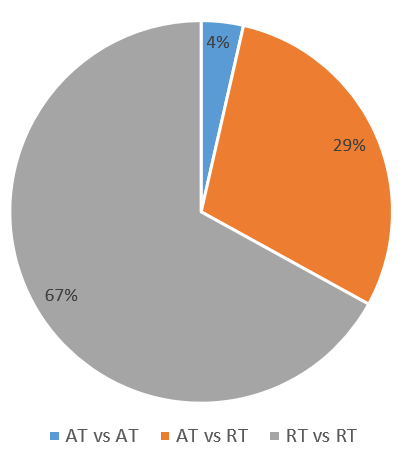
With that said, it is not surprising that most games in 3v3 are counted as RT vs. RT and there are only 4% of games where ATs meet up (see diagram above).
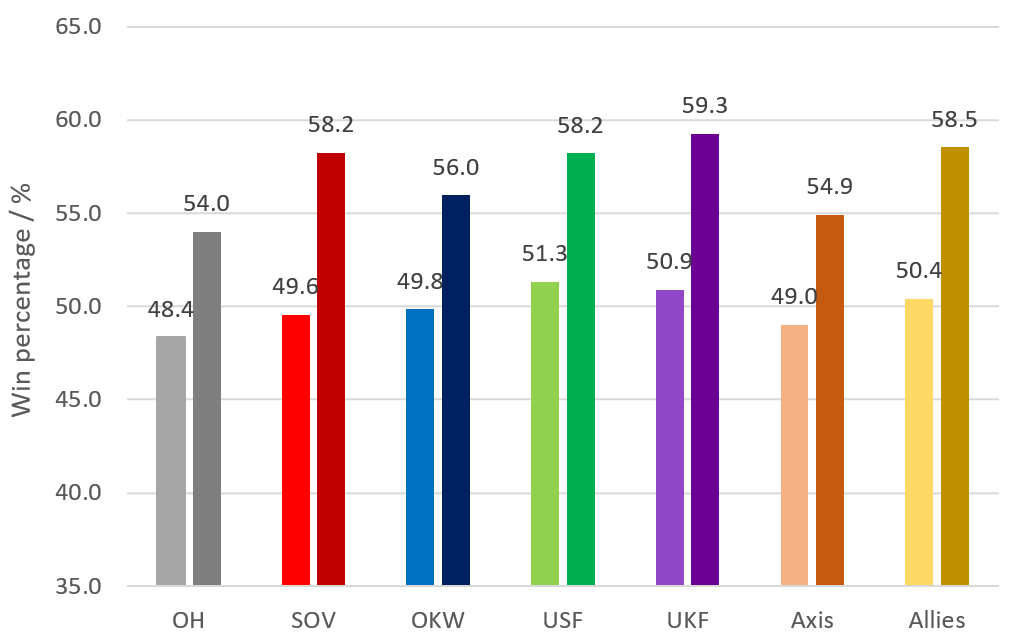
The win rates per faction for RTs (light) and ATs (dark) are listed in the diagram above. Overall, ATs have a 5% better win percentage than the RTs with USF boasting the highest win percentages for both modes. Overall, allied teams achieve a 1-2% higher winrates.
The diagram above shows the games per faction, again with separate columns for ATs and RTs. Similarly to the previous game modes, OH is the most played faction followed by SOV and OKW, end then the western allies played least, although UKF appears to be slightly more prevalent than USF.
What we also find is that there seem to be more ATs playing as allies than axis, which might be at least part of the reason for the higher win percentage for the allied side.
The chart above shows the win percentage per rank position on the random ladder. Not surprisingly, the top players achieve the highest win rates and they drop of beyond the 50% position. That said, up to the 30% bin, the allied factions achieve a significantly higher win rate then the axis side. Beyond that, the win percentages are more even.
With increasing team sizes, the differences between factions of one side will be smaller. If we interpret the - potentially not statistically significant - differences, we see that SOV win rates are lower than those for the other two allied factions, in particular at higher ladder ranks. In particular the players at the end to the ladders seem to be doing best with UKF and OKW.

For ATs, the curves are very noisy (see above), probably too noisy to draw meaningful conclusions.
The curves above show the number of games played by RTs. The number for the unranked games again is divided by 10 to fit in the diagram. Now, what we see is that there are more top players playing with one of the allied faction. Over the rest of the ladder, we have players predominantly queuing as axis. Numbers are balanced out by more unranked allied players (which still break about even in terms of win percentage).
If we look at the factions, we find the USF are more popular for higher ranking players relative to the higher ranks where UKF is use more commonly.
It seems likely that a big reason for the overall higher win rates of the allies is that more top players play on the allied side and more commonly get matched with lower ranking players.
When we look at the games for ATs, the number for "unranked" team needed to be divided by 100 to fit. So, by far the largest number of AT games are played when the team is not yet ranked. Note, that only teams that eventually got through their placement matches for at least one side will be counted here. It is likely that there are even more games played by ATs that never make it past those 10 matches and thus will be counted as RT.
The graph itself is very noisy due to the low number of samples. Seems like a correlation between number of games played and the rank of the team with higher ranking team playing more games.
3v3 - maps
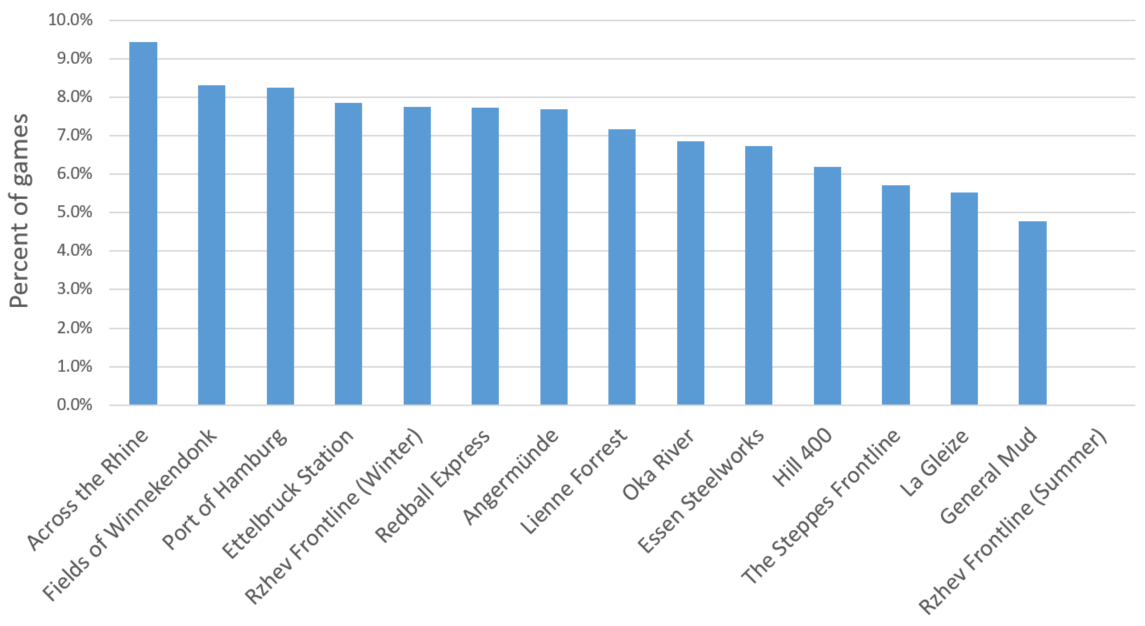
The diagram above shows the number of games played on the different maps. The most played map is "Across the Rhine", followed by "Fields of Winnekendonk" and "Port of Hamburg". The least favorite maps in 3v3 are Steppes, "La Gleize" and "General Mud". And then there was a freak game on Rzehv (Summer).
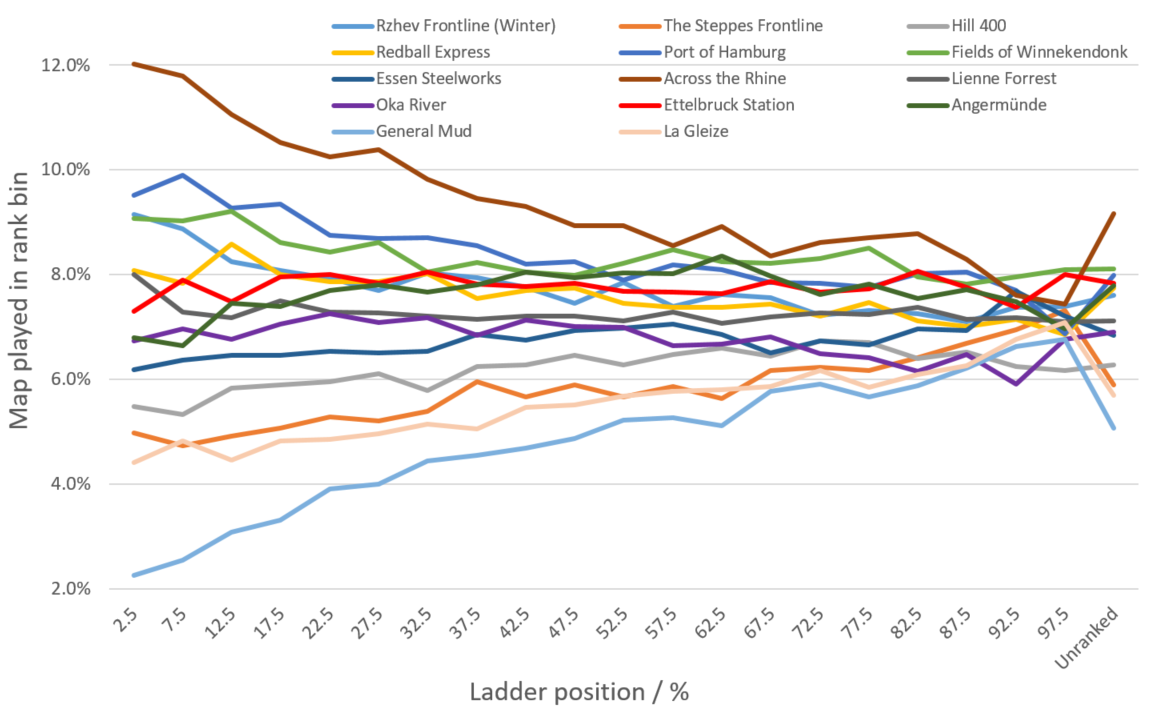
If we look at map picks versus ladder position, we see again that preferences seem to be more consistent, the better the ladder position. If we compare the choices of top players vs. those of the rest, we see that Rzhev is better liked while Ettelbrück and Angermünde are less popular with good players, relatively speaking.
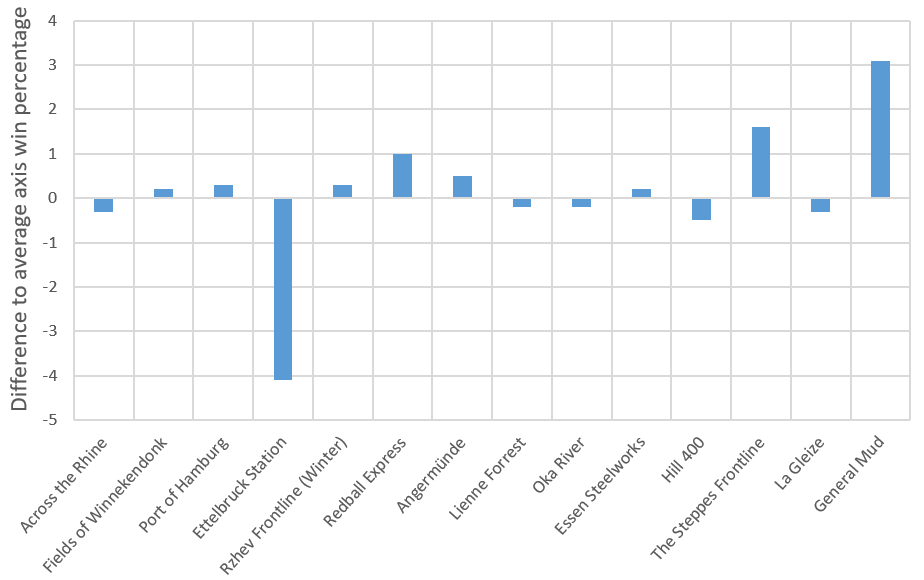
Win ratios are relatively even across maps. Again, the bars show the difference between the axis win percentage for this map and the average axis win percentage. What sticks out is that allied seem to have a higher chance to win on Ettelbrück, while Steppes and General Mud are better for axis.
Back to Index
4v4
The chart above shows the win percentages for the different factions, again with RT players in lighter and AT player in darker colors. For RTs, USF exhibits the highest win percentage while UKF wins out for ATs. The differences between the two factions, however, is small and potentially not statistically significant. OH gets the short end of the stick in both cases.
Again, the AT win percentages are significantly larger. Interestingly, the differences are about 6% for the axis factions but up to 8% for the allied factions. Overall, allies have a higher win percentage.
The number of games played by RT (left) and AT (right) are this time displayed in two different diagrams as AT game counts are more than an order of magnitude smaller than those for RTs. Numbers are similar to those found for 3v3. Again, more teams were playing on the allied side, even to the point that overall there were more games played as SOV than OH.
The win percentages for random players per faction and ladder position are very similar to the 3v3 results, but the curves are smoother due to the higher number of games. Again, the best players achieve the best win rates. For the allied factions, the win percentages then drop almost monotonically with ladder rank.
For axis players, win rates are more complex: After the peak for the top percent of players, the win percentage drop off quickly and even fall below 50% at around the 12.5% bin. After that the win percentage actually increases and starts to become higher than the allied percentage beyond the 42.5% bin. From there on it decays and falls (slightly) behind the allied win percentage at the end of the ladder.
In terms of factions we find that win percentages are similar to the general ones showed at the start of the section. SOV feature the worst percentage of the allied factions, USF does better for players that are above average in terms of ladder rank, while the lower ranking allied players achive the best percentages with UKF. On the axis side, OKW exhibits higher win percentages than OH for most parts of the ladder, with the exception of the 12.5%-37.5% bins. Beyond the 47.5% bin, OKW in fact has the highest win percentage of all factions.
Graphs for ATs (above) again are too noisy to be useful.
The diagram above shows the numbers of games played by random players per faction and ladder rank. The curves show a structure that is very similar to the corresponding curves in 3v3: Again, way more good players play as allies while the rest of the ladder (with the exception of the unranked players, again scaled down by a factor of 0.1) is more dominated by axis players.
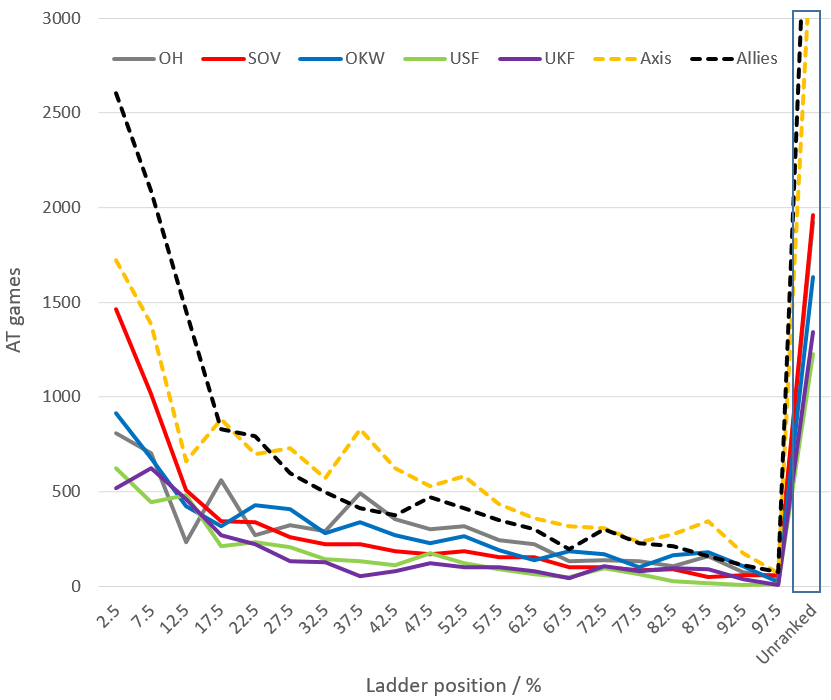
While curves for the ATs are somewhat smoother than in the 3v3 case, they are still fairly noise, but overall show the same trend as the RT curves.
4v4 - maps
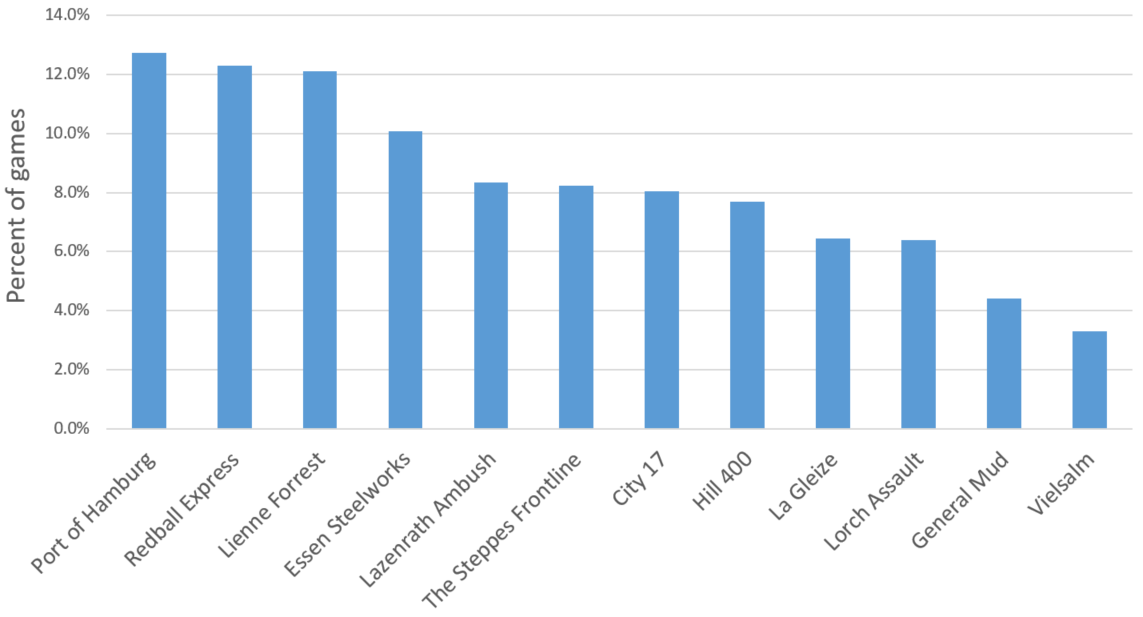
The most popular 4v4 maps are "Port of Hamburg", "Redball Express" and "Lienne Forrest", the least played are "Vielsalm" and "General Mud".
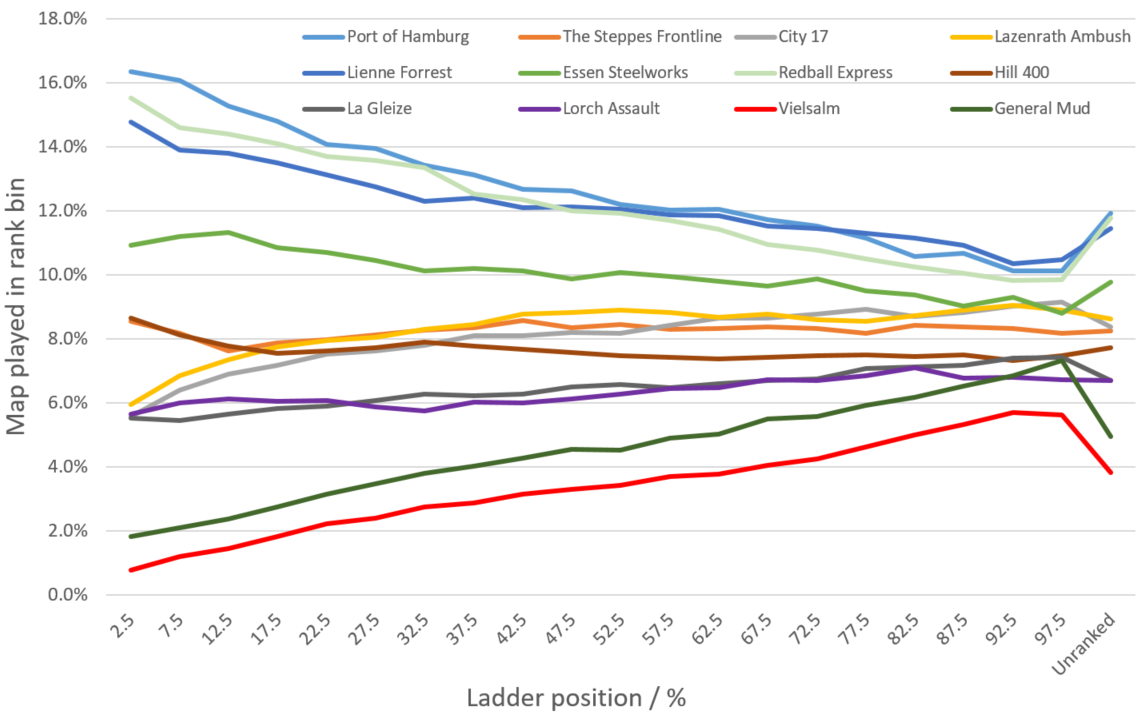
Map picks vs. ladder rank are shown in the diagram above. Again, the differences are more pronounced for top players than for the rest, although the difference here appears to be smaller than for the other games modes. Rankings, though, seem to be very similar across the ladder, with the exception of "Hill 400" and Steppes which are more and Lazenrath and City 17 with are less popular for the top players compared with the rest.
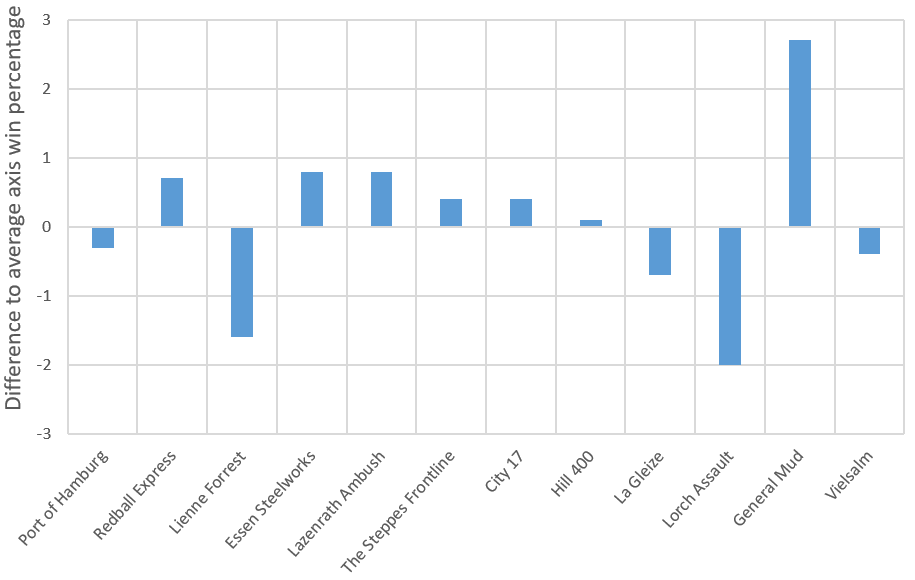
The diagram above shows difference to the average axis win percentage for the different maps. On "General Mud", axis seems to be more successful while the allied forces have the upper hand on Lienne Forrest and Loch Assault.
Back to Index
Conclusions
There are a couple of conclusions that we can draw from the data presented here.
- The differences in win percentages between factions are actually comparably small for the majority of the ladder positions (about +/- 2% around the average bin win percentage). Larger differences are mostly observed for the top 10-20% of players, where there are indications that these imbalances are mostly produced by an imbalance of players queuing at the different ladder ranges.
- OH players seem to experience the worst winrates across all game modes and ladder positions although there are a few ladder ranges where they are not significantly worse or even slightly better than the other factions. Still, there are more games played as OH than any other faction.
- On the allied side, SOV players experience the worst win rate on average.
- OKW often features a significantly better win percentages than OH, in particular for players that have higher ladder ranks.
- If we compare allied to axis win percentages we find that they are very similar for 30+% ladder bins. Win percentages are less balanced for the top 30% of players, though in particular for 3v3 and 4v4 where allies fare far better than axis. However, in these game modes more ATs and good random players queue as allies which is expected to skew win percentages significantly.
- 2v2 appears to be fairly balanced with axis and allies winning about the same number of games across the ladder. However, team composition seems to play a role as OH/OH and SOV/SOV appear to be significantly weaker and OKW/OKW stronger than the rest.
- Unranked players seem to be doing better, the larger the game mode, likely because there the rest of the team might be able to carry a newer player.
- Arranged teams do better than random teams. However, differences are small in 2v2 and increase with the game mode.
- The worse a players rank, the less consistent the map vetoes appear to be.
Back to Index
 Siphon X.
  RitaBrush
  MajorBloodnok
  FichtenMoped
  Jae For Jett


 cblanco ★
  보드카 중대
  VonManteuffel
  Heartless Jäger